Hi Traders, we have a potential swing short set-up to consider this week.
Today, we’re diving into a detailed GBP/JPY pair analysis, focusing on recent breakout and retracement setups observed from May to June 2024. This guide will break down the key technical levels, including support and resistance zones, and highlight potential trading strategies using annotated charts. Whether you’re new to trading or an experienced trader, this step-by-step breakdown will provide actionable insights.
Monthly Chart Analysis: Major Fibonacci Levels
Starting with the monthly chart, we can observe key Fibonacci retracement levels drawn from the major high in March 2007 to the low in October 2011. This helps us identify significant levels where the price might react.
Key Observations:
- 61.8% Retracement Level: Around 199.47
- Current Price Level: Testing the 61.8% retracement level
- Support Levels: 177.50 (50% level) and 160.45 (38.2% level)
The 61.8% level is a crucial resistance point, often called the “golden ratio.” A successful close above this level could signal further bullish momentum, targeting the next major resistance around 225.00. Conversely, rejection could lead to a retracement towards the 50% or 38.2% levels.
Factor 1—Weekly Chart Price is at a major 618 retracement level and seems to have stalled for the past two weeks. Previous price structure resistance around March 2008(!). Let’s start drilling down into the details of the smaller timeframes.

Weekly Chart Analysis: Hanging Man Candlestick Pattern
Next, let’s move to the weekly chart (Image 1), where we notice a prominent hanging man candlestick pattern formed around the last week of May 2024. This pattern typically signals a potential reversal from an uptrend to a downtrend, especially when it appears at the top of an upward price movement.
Factor 2- Hanging Man Pattern on Weekly Chart

Key Observations:
- Formation Date: Late May 2024
- Price Level: Around 199.00
- Technical Significance: The long lower wick indicates selling pressure, potentially leading to a bearish reversal.
To confirm this setup, we look for subsequent bearish candles that close below the low of the hanging man. Traders can place stop-loss orders just above the hanging man’s high (around 199.50) and target lower support levels for potential take-profit areas.
Broken Price Structure Support
Now, let’s drill down to the 4-hour chart, where we can see a clear break (and close below the blue box) of the price structure support, indicating a potential shift from bullish to bearish sentiment.
Factor 3 – Broken price structure support, lower highs, lower lows.

Price has also retraced to a minor double-top formation around 199.70, retesting a resistance zone.
Factor 4 – Double Top / Resistance Zone retest

In this scenario, we have 4 confluence factors to consider in a short setup.
- Weekly 618 Retracement Zone with Previous Price Structure Resistance Zone
- Weekly hanging man pattern
- H4 Price support structure broken with lower highs and lower lows
- H4 Double Top – resistance zone retest
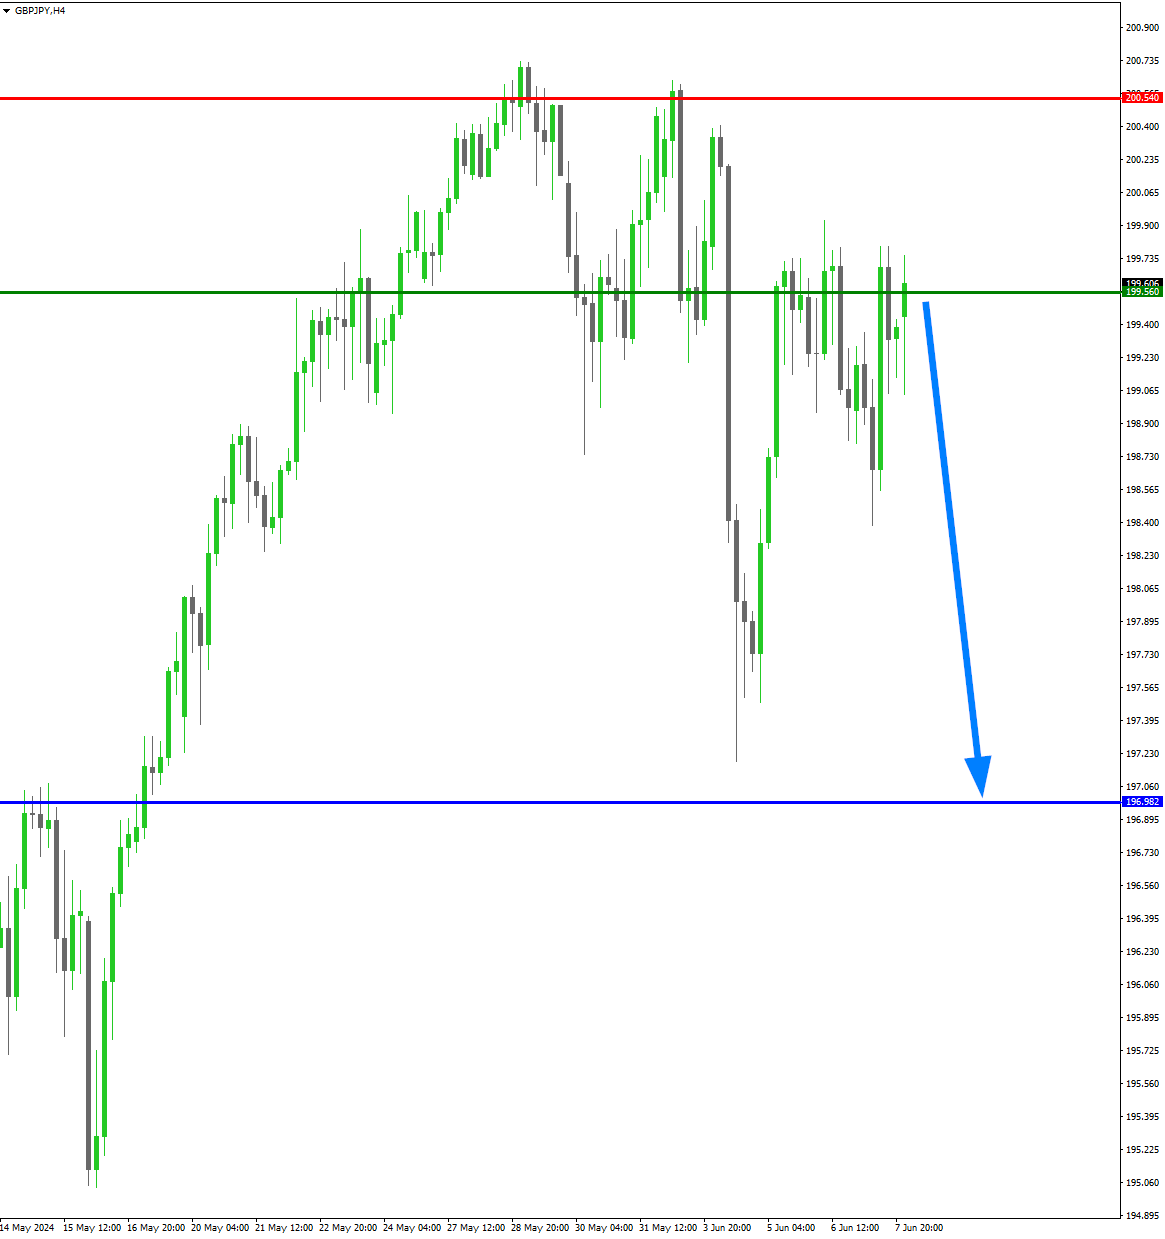
Short Sell Trade Setup for GBP/JPY
Finally, let’s look at the annotated chart detailing trade entry levels. This chart highlights key areas where traders could enter short positions, manage their trades, and set stop-loss orders.

Key Observations:
- Entry Price: 199.560 (Green Line)
- Stop-Loss: 200.540 (Red Line)
- Take-Profit: 196.982 (Blue Line)
Trading Strategy:
- Entry Point:
- Initiate short positions around 199.560
- Stop-Loss:
- Place stops just above the recent high at 200.540 to limit potential losses.
- Take-Profit Target:
- Set at 196.982, aiming for the next major support level indicated by the blue line.
Risk-to-Reward 1:2.63
Best Way to Manage This Trade
Once you’ve entered the short position at 199.560, it’s crucial to have a plan for managing the trade effectively. Here are some tips to help you navigate this trade:
- Initial Setup:
- Entry: 199.560
- Stop-Loss: 200.540
- Take-Profit: 196.982
- Trail Your Stop-Loss:
- Consider trailing your stop-loss to lock in profits as the trade moves in your favour. For instance, if the price drops to 198.500, you could move your stop-loss to break even or slightly below your entry price (e.g., 199.300). This minimizes risk while securing some profit.
- Partial Profit Taking:
- Another strategy is to take partial profits at key support levels. If the price reaches 198.500, you could close half of your position and let the remaining part run to your final take-profit target at 196.982.
- Monitor Price Action:
- Keep an eye on significant price action around support levels. If you notice strong bullish reversal patterns near your take-profit zone, it might be wise to close the trade early and secure your gains.
- Adjust Based on Market Conditions:
- Stay flexible and ready to adjust your strategy based on changing market conditions. If significant news or unexpected volatility occurs, you may need to reassess your stop-loss and take-profit levels.
- Stay Disciplined:
- Stick to your trading plan and avoid making impulsive decisions based on emotions. Consistency and discipline are key to successful trading.
Summary:
You can maximise your gains while minimising risk by managing your trade with a clear plan, trailing stops, and partial profit-taking strategies. Always stay alert to market conditions and adjust your plan as necessary. Remember, effective trade management is just as important as the initial setup.
Happy trading, and may the pips be with you!
Cheers,
Shigeru

