
Hello Traders!
Today, we’re diving into an intriguing chart of Ethereum (ETH/USD) on the daily timeframe, focusing on a bullish breakout that has recently occurred. In this post, we’ll explore three primary strategies: the Trading Breakout Strategy using the ‘2 Hill 2 Valley’ technique, and the Support and Resistance Levels strategy. Let’s break down the chart step-by-step, discuss our observations, and pinpoint potential trading opportunities.
Understanding the Chart
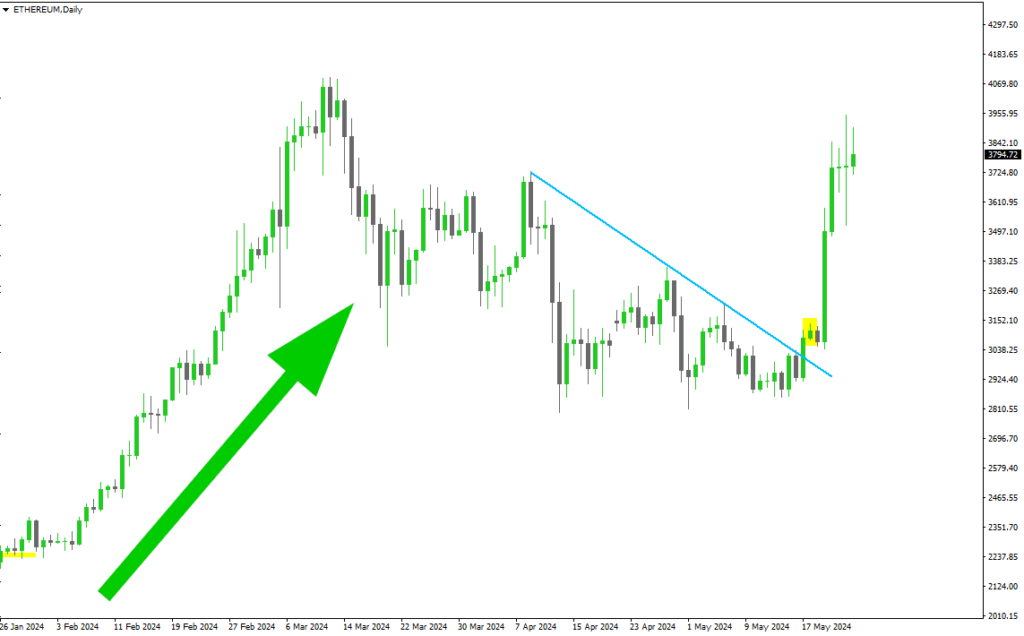
In the provided chart, we see a well-defined downtrend followed by a significant bullish breakout. Key elements highlighted include a downsloping trendline, a confirmation candlestick, and a strong upward movement. Let’s dissect these elements in detail and understand how they form a crucial part of the Ethereum breakout strategy.
Identifying the Trend and Breakout
Strategy 1: Trading Breakout Strategy using ‘2 Hill 2 Valley’
The ‘2 Hill 2 Valley’ technique is a powerful method to spot potential breakouts. Here’s how we applied this strategy for the Ethereum breakout:
- Trendline Formation: The blue line represents the downsloping trendline connecting lower highs from 14th March 2024 to 1st May 2024. This trendline acts as a dynamic resistance crucial to our Ethereum breakout strategy.
- Breakout Confirmation: The yellow-highlighted candlestick on 16th May 2024 is our confirmation candlestick. This is where the price decisively breaks above the trendline, signalling a potential bullish move.
- Entry Point: Upon the breakout, an entry can be made at the close of the confirmation candlestick around $3,034.72, marking an essential entry point in our Ethereum breakout strategy.
- Stop Loss: A prudent stop loss can be placed just below the previous low on 9th May 2024, approximately at $2,810.00, ensuring a risk-to-reward ratio of about 1:3, depending on the target.
Fun Fact: Ethereum’s potential lies not only in its price action but also in its utility for decentralised applications (DApps), making it a critical asset in the cryptocurrency world.
Support and Resistance Levels
Strategy 3: Support and Resistance Strategy
- Key Support Levels: Support is evident around $2,400, where the price has previously bounced back in late April 2024. This level is crucial for the Ethereum breakout strategy.
- Key Resistance Levels: The breakout resistance was around $3,034.72, which, once breached, can act as new support.
- Post-Breakout Movement: Following the breakout, Ethereum surged past $3,724.80 by 22nd May 2024, demonstrating the strength of the bullish move and the effectiveness of the Ethereum breakout strategy.
Managing the Trade
After entering the trade post-breakout, there are a few ways to manage it:
- Trailing Stop Loss: Implement a trailing stop loss to lock in profits as the price moves in your favour.
- Profit Targets: Set multiple profit targets. The first target could be the next resistance level around $3,724.80, and subsequent targets can be adjusted as new highs are formed.
Fibonacci Retracement Levels
While the current chart doesn’t display Fibonacci retracement levels, it’s a strategy worth mentioning for future reference. Fibonacci retracement is a popular tool used by traders to identify potential support and resistance levels based on the Fibonacci sequence. Typically, the key levels are 38.2%, 50%, and 61.8%.
Strategy 2: Fibonacci Retracement Strategy
- Identifying the Swing High and Swing Low: First, identify the most recent swing high and swing low. These points help in plotting the Fibonacci levels.
- Drawing the Fibonacci Levels: Draw the Fibonacci retracement from the swing high to the swing low. This will display the key retracement levels.
- Observing Price Action at Fibonacci Levels: Watch how the price reacts at these levels. A strong reversal at a Fibonacci level can indicate a significant support or resistance zone.
- Entry Points: If the price retraces to a Fibonacci level and shows a reversal pattern (e.g., a bullish engulfing candlestick), it could be an entry signal for the Ethereum breakout strategy.
- Stop Loss and Targets: Place a stop loss just below the swing low (for long positions) and set profit targets at subsequent Fibonacci levels.
Fun Fact: Fibonacci retracement is based on the Fibonacci sequence, which appears frequently in nature, art, and architecture, making it a fascinating tool in financial markets as well.
Combining Strategies for Better Accuracy
Combining the breakout strategy with support and resistance levels and Fibonacci retracement can enhance the accuracy of your trades. Here’s how:
- Confirm Breakouts with Fibonacci Levels: If a breakout aligns with a key Fibonacci level, it strengthens the validity of the breakout in the Ethereum breakout strategy.
- Use Support and Resistance for Targets: Set your profit targets based on historical support and resistance levels. This can help in identifying realistic price targets for the Ethereum breakout strategy.
- Risk Management: Combining these strategies also allows for better risk management. For instance, a stop loss below a Fibonacci level that aligns with historical support can offer additional protection.
Practical Example
Let’s consider a hypothetical scenario to illustrate these strategies in action:
- Identifying the Setup: Assume Ethereum is in a downtrend from mid-March 2024 to early May 2024, and you spot a potential reversal. You draw a downsloping trendline and observe that the price is approaching this trendline.
- Confirmation Candlestick: On 16th May 2024, the price breaks above the trendline, and you see a confirmation candlestick closing above it. This is your entry signal for the Ethereum breakout strategy.
- Drawing Fibonacci Levels: You then draw Fibonacci retracement levels from the most recent swing high in mid-February 2024 to the swing low in early May 2024. You observe that the breakout coincides with the 50% Fibonacci level.
- Setting Stop Loss and Targets: Place your stop loss just below the swing low and set your first profit target at the next resistance level, which might also align with the 61.8% Fibonacci level.
- Managing the Trade: As the price moves in your favour, you implement a trailing stop loss to secure profits. You also monitor price action at the 61.8% Fibonacci level to decide if you want to exit partially or fully.
Risk Management
- Risk-to-Reward Ratio: With a stop loss at $2,810.00 and a first target at $3,724.80, the risk-to-reward ratio is approximately 1:3. This ratio is favourable, suggesting a good trade setup in the Ethereum breakout strategy.
- Alternate Stop-Loss Areas: For those with a higher risk appetite, a tighter stop loss could be placed just below the breakout point, reducing potential losses if the price reverses.
Conclusion and Insights
The Ethereum chart provides a textbook example of a bullish breakout from a downsloping trendline. By combining the ‘2 Hill 2 Valley’ technique with support and resistance levels and considering Fibonacci retracement, we can identify high-probability trading opportunities. Always remember to manage your risk appropriately and adjust your strategy based on market conditions.
Further Reading and Resources
To delve deeper into the strategies mentioned, check out these detailed guides:
- Trading Breakout Strategy using ‘2 Hill 2 Valley’
- Support and Resistance Strategy
- Fibonacci Retracement Strategy
If you’re new to trading or want to practise these strategies risk-free, consider using Forex Tester. It’s an excellent tool for backtesting and refining your trading skills.
Happy Trading!
Shigeru