Candlestick Basics

What is a Candlestick?
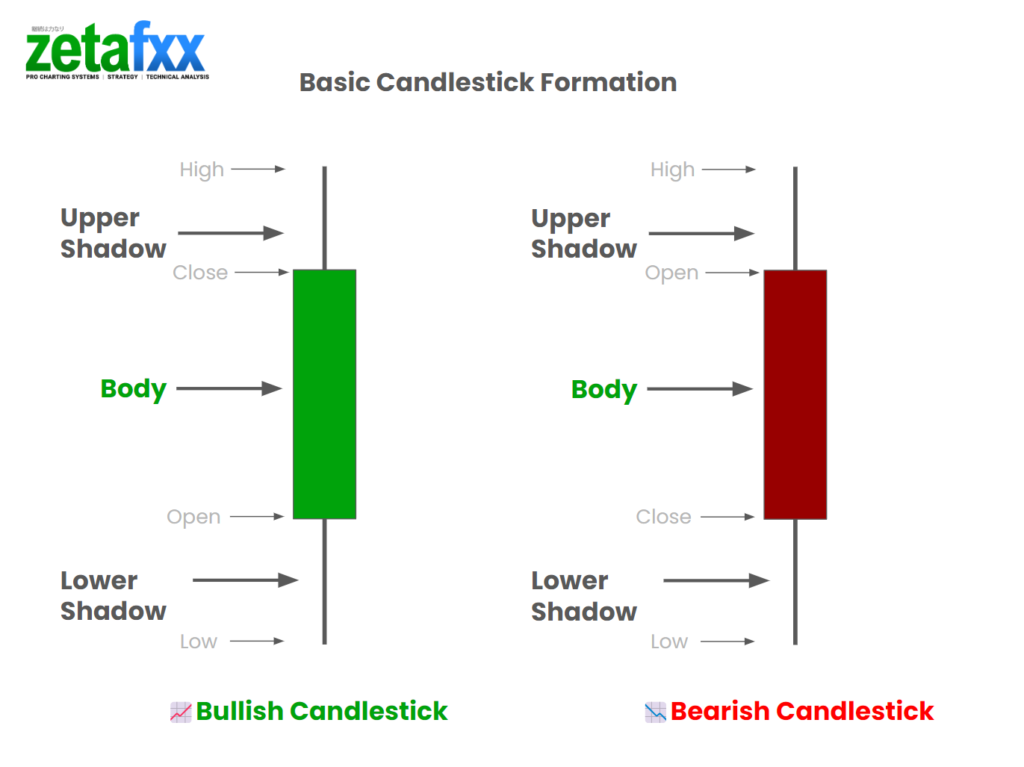
A candlestick is a type of price chart used in technical analysis that displays a security’s high, low, open, and close prices for a specific period. It visually represents price movements in a trading day or over a series of trading days. Candlesticks are used to predict price movement based on past patterns.
Components of a Candlestick
Each candlestick consists of three main parts:
- Body: The candlestick shows the opening and closing prices during the set period. If the close is higher than the open, the body is typically green or red, indicating a price increase (green bullish candle). If the close is lower than the open, the body is coloured red, showing a price decrease (red bearish candle).
- Upper Shadow (Wick): The upper shadow extends from the top of the body to the highest price during the period. It represents the maximum price reached.
- Lower Shadow (Tail): The lower shadow stretches from the bottom of the body to the lowest price during the period, indicating the minimum price reached.
🧐Interesting facts: Candlestick charting first appeared in Japan in the 17th century, developed by a rice trader named Munehisa Homma. He used this technique to trade rice contracts and amassed a huge fortune, highlighting early on how powerful this method of technical analysis could be.
Reading Candlesticks
Understanding how to read a candlestick is crucial for making trading decisions. Here’s what you need to look for:
- Bullish Candlestick: A green or white body indicates buying pressure. If the body is long, it suggests strong buying interest.
- Bearish Candlestick: A red or black body signals selling pressure. A longer body indicates strong selling interest.
- Short Body: Indicates little price movement and can be considered consolidation.
- Long Shadows: It Suggests that during the trading period, prices extended well beyond the opening and closing prices but retreated before the period closed, showing volatility.
✨Interesting fact: In Chinese markets, traders prefer using Green for bearish candles and Red for Bullish candles, as Red is a lucky colour, as seen by the Chinese.
Common Candlestick Patterns
Candlesticks form patterns that can predict future price movements. Some common patterns include:
- Doji: Characterized by a very small or nonexistent body and long shadows. It indicates indecision among traders.
- Hammer: A candlestick with a long lower shadow and a short body at the top of the trading range suggests a potential upward reversal.
- Engulfing Pattern: This occurs when a large candlestick fully engulfs the body of one or more of the previous candlesticks, indicating a possible reversal.
Why Use Candlesticks?
Candlesticks are popular among traders because they provide more information than a simple line chart and can be used to detect market trends and reversals quickly. By recognizing patterns, traders can speculate on how prices might move in the future.
By studying these visual tools and their patterns, even as a beginner, you can start to make informed decisions about your trading activities.

